Understanding the Overvaluation of the S&P 500 Through the Shiller P/E Ratio and Historical Market Trends
- Clay Henry
- Jan 19
- 3 min read

The stock market often feels like a rollercoaster, with prices soaring one moment and plunging the next. Investors constantly ask whether the market is fairly valued or dangerously overvalued. One key tool to assess this is the Shiller Price-to-Earnings (P/E) ratio. This blog post explains what the Shiller P/E ratio is, why it matters, and what history tells us about market behavior when this ratio reaches high levels, especially in the context of the S&P 500.

What Is the Shiller P/E Ratio?
The Shiller P/E ratio, also called the cyclically adjusted price-to-earnings ratio (CAPE), measures the price of stocks relative to their average earnings over the past 10 years, adjusted for inflation. Unlike the traditional P/E ratio, which looks at earnings from just the last year, the Shiller P/E smooths out short-term fluctuations in earnings caused by economic cycles.
This longer-term view helps investors understand whether stocks are priced reasonably based on historical earnings trends or if prices have become inflated. A high Shiller P/E ratio suggests stocks may be overvalued, while a low ratio could indicate undervaluation.
Why the Shiller P/E Ratio Matters for the S&P 500
The S&P 500 index tracks 500 of the largest publicly traded companies in the U.S. It serves as a broad indicator of the overall stock market’s health. Investors use the Shiller P/E ratio on the S&P 500 to gauge whether the market is expensive or cheap compared to historical norms.
Historically, the average Shiller P/E ratio for the S&P 500 has hovered around 16 to 17. When the ratio climbs well above this range, it signals that stock prices have risen faster than earnings, raising concerns about a potential market correction or crash.
Historical Highs of the Shiller P/E Ratio and Market Outcomes
Looking at past periods when the Shiller P/E ratio was unusually high reveals important lessons about market risks.
The Late 1920s and the Great Depression
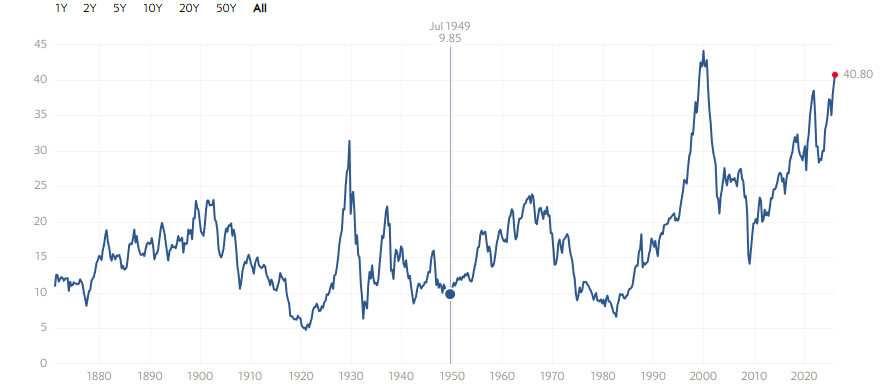
In the late 1920s, the Shiller P/E ratio for the market reached levels above 30, driven by speculative buying and optimism. This extreme overvaluation preceded the stock market crash of 1929, which triggered the Great Depression. The market lost nearly 90% of its value over the following years, showing how dangerous high valuations can be.
The Dot-Com Bubble of the Late 1990s
The Shiller P/E ratio soared above 40 during the late 1990s as investors poured money into internet and technology stocks. This bubble burst in 2000, leading to a sharp market correction where the S&P 500 lost about 50% of its value over the next two years. This episode highlights how excessive optimism and high valuations can lead to painful market declines.
The 2007-2008 Financial Crisis
Before the financial crisis, the Shiller P/E ratio was elevated, though not as extreme as during the dot-com bubble. It hovered around 27 in 2007. The crisis caused a severe market downturn, with the S&P 500 dropping more than 50% by early 2009. This period showed that even moderately high valuations combined with economic shocks can lead to significant losses.
What Does the Shiller P/E Ratio Tell Us Today?
As of recent years, the Shiller P/E ratio for the S&P 500 has again reached levels above 30, raising concerns about overvaluation. This suggests that stock prices are high relative to their long-term earnings, which could mean the market is vulnerable to a correction.
However, it is important to remember that the Shiller P/E ratio is not a timing tool. Markets can remain overvalued for extended periods, and other factors like interest rates, economic growth, and investor sentiment also influence market direction.
Practical Takeaways for Investors
Use the Shiller P/E ratio as a warning signal, not a prediction. High values suggest caution but do not guarantee a crash.
Diversify investments to reduce risk if the market is overvalued.
Focus on long-term goals rather than short-term market swings.
Monitor other economic indicators alongside valuation metrics for a fuller picture.
Understanding the Shiller P/E ratio helps investors make more informed decisions by providing context on how current market prices compare to historical earnings. Recognizing periods of overvaluation can encourage a more cautious approach and better risk management.


Comments